 図解アロマ
図解アロマ 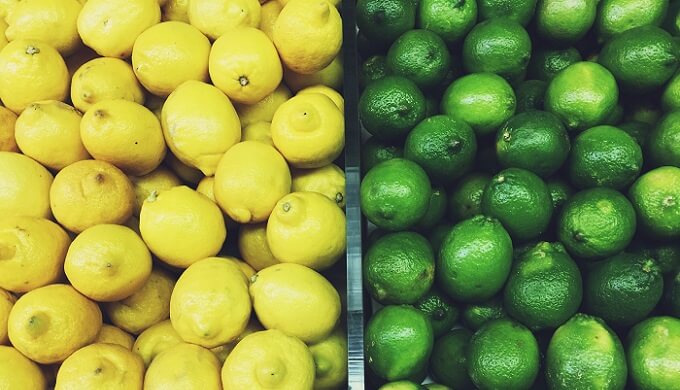

目次
[Graphic explanation] Lemon Oil Comes from Argentina, Lime Oil from Mexico
Hello. I’m Fig working in a flavor and fragrance industry for about 10 years.
Lemon oil and lime oil (essential oil) are a kind of nature products. Where do we get it from? Mainly we can get lemon oil from Argentina and lime oil from Mexico.
Lemon oil : Argentina, the U.S., Italy
Lime oil : Mexico
First a lemon and lime crop calendar is shown as the following.
Crop Calendar
Lemon

Lemon crop season is shown as the green color in the calendar.
- Brazil : March – May, October – December
- US : December – June
In Italy there are three or four times crop seasons depending on the lemon variety.
Lime
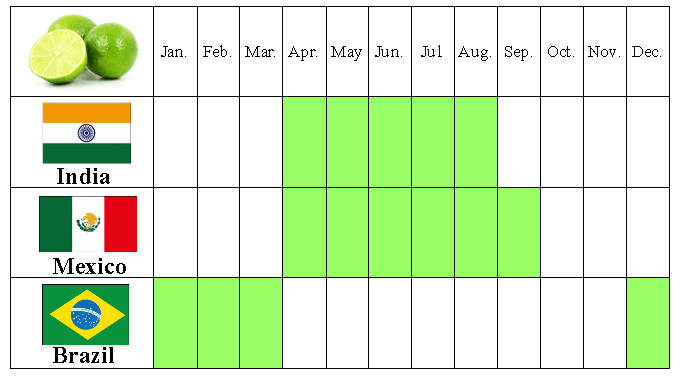
- India : April – August
- Mexico : April – September
- Brazil : December – March
There is the difference of crop season because of the north-south difference. In case Mexico is in summer, Brazil is in winter.
Next is a global lemon and lime production.
Global Lemon and Lime Production
Change of Global Production (more than 10 years)
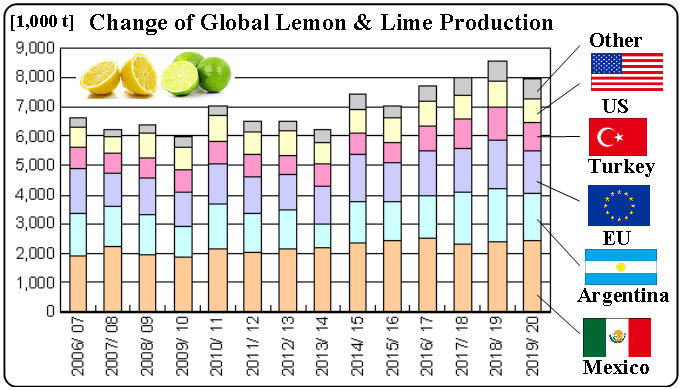
ref. United States Department of Agriculture (USDA)
Global Production is about 8 million tons. It is increasing slightly.
- Mexico : increasing slightly
- Argentina : increasing
- EU : stable
- Turkey : increasing slightly
- US : stable
Next is a breakdown of a global lemon and lime production by region.
Breakdown of Global Production by Region
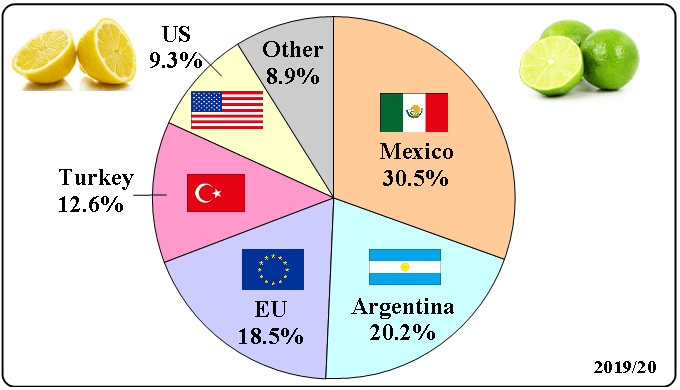
(2019/20 forecast)ref. United States Department of Agriculture (USDA)
- Mexico 30.5%
- Argentina 20.2%
- EU 18.5%
- Turkey 12.6%
- US 9.3%
Mexico accounts for about 30%, and these 5 regions for about 90%.
Next is a global lemon and lime production with a world map.
Global Production (Map)
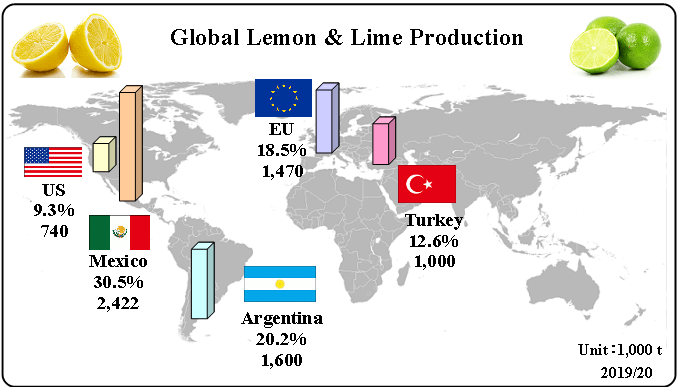
(2019/20 forecast)ref. United States Department of Agriculture (USDA)
North America (Mexico and the U.S.) and South America (Argentina) account for about 60% of the global lemon and lime production.
It will be useful to image the production with the map.
Next is a global lemon and lime consumption for fresh.
Global Fresh Domestic Consumption
Change of Global Fresh Domestic Consumption (more than 10 years)
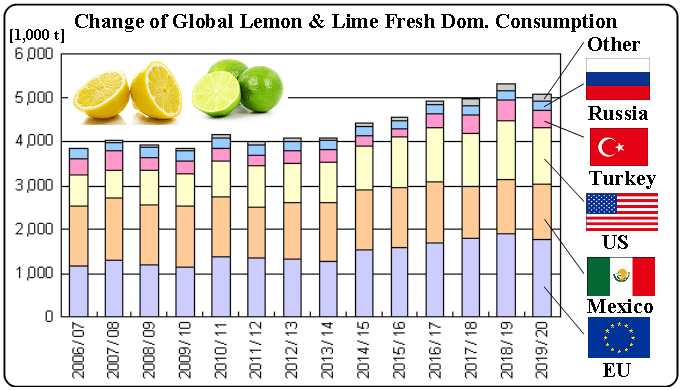
ref. United States Department of Agriculture (USDA)
Lemon and Lime for fresh
The global fresh domestic consumption is about 5 million tons. It is increasing.
- EU, US : increasing slightly
- Mexico, Turkey, Russia : stable
Next is a global lemon and lime consumption with a world map.
Global Fresh Domestic Consumption (Map)
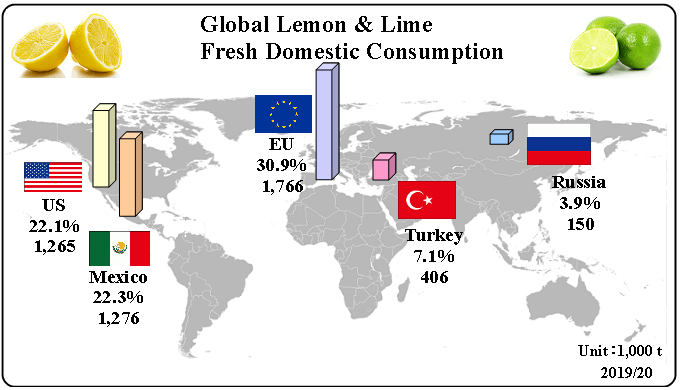
(2019/20 forecast)ref. United States Department of Agriculture (USDA)
The EU, Mexico and the U.S. are main regions and account for more than 70%
- EU 24.7%
- Mexico 19.3%
- US 16.5%
- Turkey 8.5%
- Russia 4.4%
In the U.S. and the EU, their domestic consumption are over their production. It means that they import lemon and lime from other countries.
A ratio of for fresh and for processing can be changed by regions. Next is the ratio by regions.
Breakdown of Use by Region
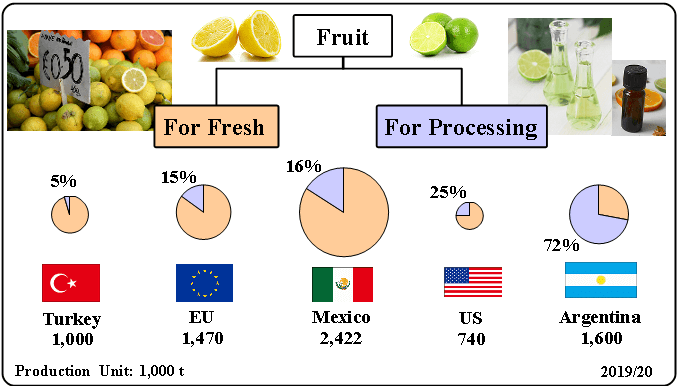
(2019/20 forecast)ref. United States Department of Agriculture (USDA)
In a pie chart, colors show use, its size shows production.
- orange color : for fresh
- blue color : for processing
- pie chart size : production
- number % : ratio for processing
Only Argentina is the high ratio for processing.
Next is a global lemon and lime consumption for processing.
Global Consumption For Processing
Change of Global Consumption For Processing (more than 10 years)
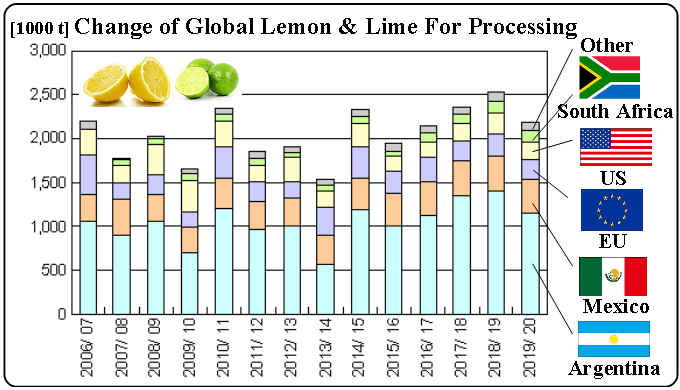
ref. United States Department of Agriculture (USDA)
Lemon and Lime for processing
The global lemon and lime consumption for processing is about 2 million tons. It is increasing. Argentina mostly affects the consumption volume.
- Argentina : increasing
- Mexico : stable
- EU : stable
Next is a global lemon and lime consumption for processing with a world map.
Global Consumption For Processing (Map)
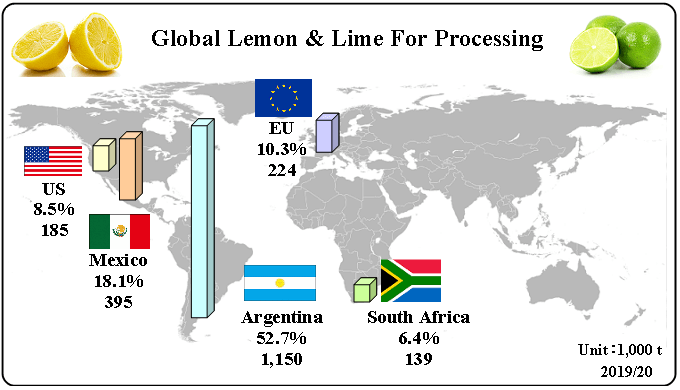
(2019/20 forecast)ref. United States Department of Agriculture (USDA)
Argentina accounts for half of the global lemon and lime consumption for processing. Argentina has a big impact on juice and oil for lemon mainly.
- Argentina : 52.7%
- Mexico : 18.4%
- EU : 10.3%
The main regions we can get lemon oil and lime oil are as the following.
Lemon oil : Argentina, the U.S., Italy
Lime oil : Mexico
Summary
Lemon and Lime Production
- Global Production : 8 million tons
- For Fresh : 5 million tons
- For Processing : 2 million tons
Once the fruits are used for fresh, they can not be used for processing. We can get juice and oil from lemons and limes for processing. Argentina is a main region of lemon and lime consumption for processing. The main regions of lemon oil and lime oil production are as the following.
Lemon oil : Argentina, the U.S., Italy
Lime oil : Mexico