 図解アロマ
図解アロマ 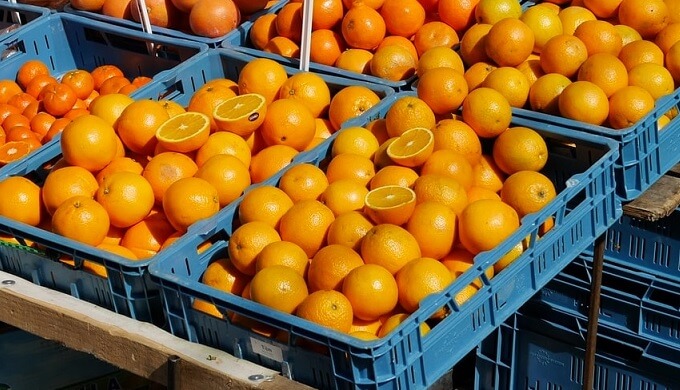

目次
[Graphic explanation] Orange Production – Where Do We Get Orange Oil From?
Hello. I’m Fig working in a flavor and fragrance industry for about 10 years.
Orange oil (essential oil) is a kind of nature products. Where do we get it from? They are Brazil and the U.S. mainly. Especially Brazil has a big production volume. First the global orange production is shown as the following.
Orange Crop Calendar
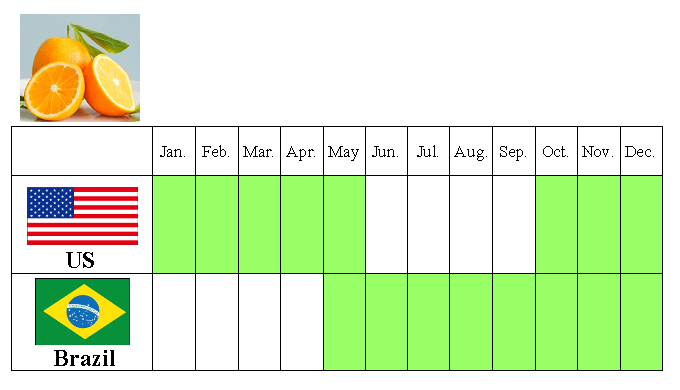
Crop season is shown as the green color in the calendar.
- US : Oct. – May
- Brazil : May – Dec.
There is the difference of crop season because of the north-south difference. In case the U.S. is in summer, Brazil is in winter.
By the way, In Japan mandarins are more popular than oranges. (Japan is not climatically suitable for growing orange.)
Next is a global orange production.
Global Orange Production
Change of Global Orange Production (more than 10 years)
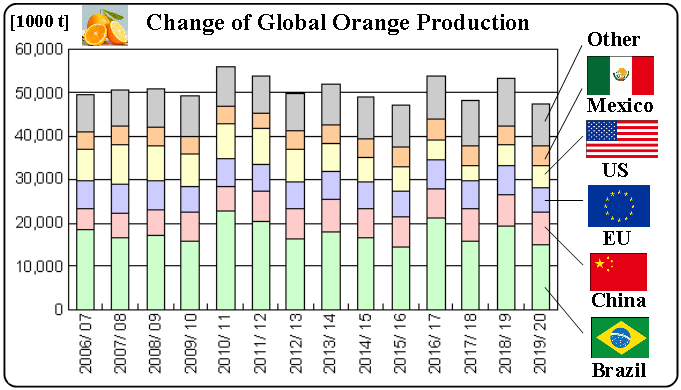
ref. United States Department of Agriculture (USDA)
Global Production : about 50 million tons
It is decreasing slightly.
- Brazil : It depends on the year.
- China : stable
- EU : stable
- US : decreasing slightly
- Mexico : stable
Brazil is an important region because it affects the global orange production volume
Next is a breakdown of a global orange production by region.
Breakdown of Global Orange Production by Region
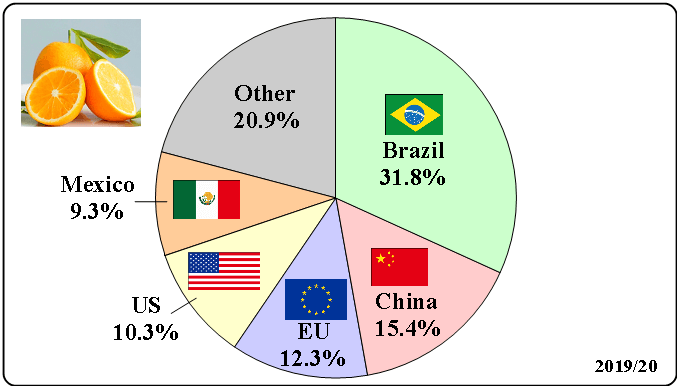
(2019/20 forecast)ref. United States Department of Agriculture (USDA)
- Brazil 31.8%
- China 15.4%
- EU 12.3%
- US 10.3%
- Mexico 9.3%
Brazil accounts for about 30%, and these 5 regions for about 80%.
Next is a global orange production with a world map.
Global Orange Production (Map)
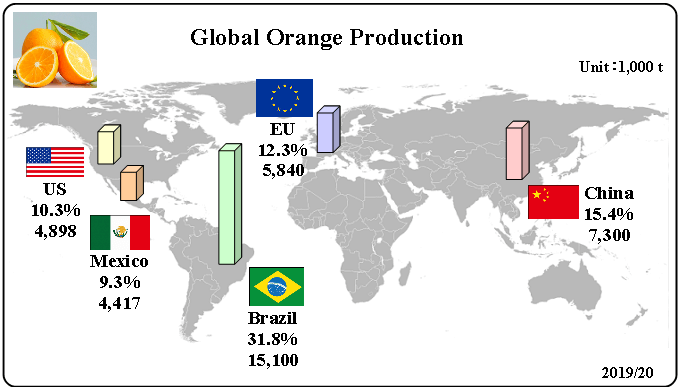
(2019/20 forecast)ref. United States Department of Agriculture (USDA)
North America (the US and Mexico) and South America (Brazil) account for half of the global orange production.
It will be useful to image the production with the map.
Use of Orange (Citrus) For Fresh & For Processing
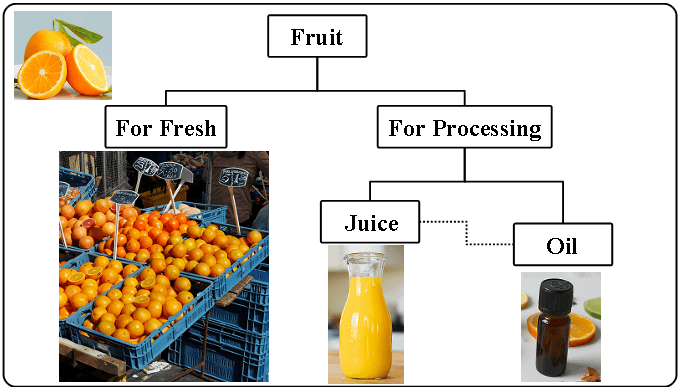
There are two kinds of use.
- For Fresh
- For Processing (Juice and oil)
Point
Once the fruits are used for fresh, they can not be used for processing. So when we would like to know the volume of orange oil production, we need to check the consumption for processing.
For processing
- main product : juice
- by product : essential oil
We can get mainly juice, in addition essential oils from peels. In case a number of a parson would like to drink orange juice (demand) is decreasing, a juice production is decreasing. Then, an essential oil production is decreasing. An essential oil is just by product.
Next is a global orange consumption for fresh.
Global Orange Fresh Domestic Consumption
Change of Global Orange Fresh Domestic Consumption (more than 10 years)
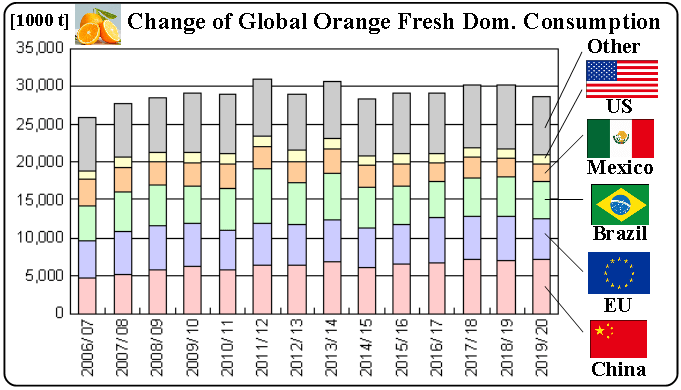
ref. United States Department of Agriculture (USDA)
Orange for fresh
Global Fresh Dom. Consumption : about 30 million tons
It is about stable.
- China : increasing slightly
- EU, Brazil, Mexico : decreasing slightly
- US : stable
Next is a global orange consumption with a world map.
Global Orange Fresh Domestic Consumption (Map)
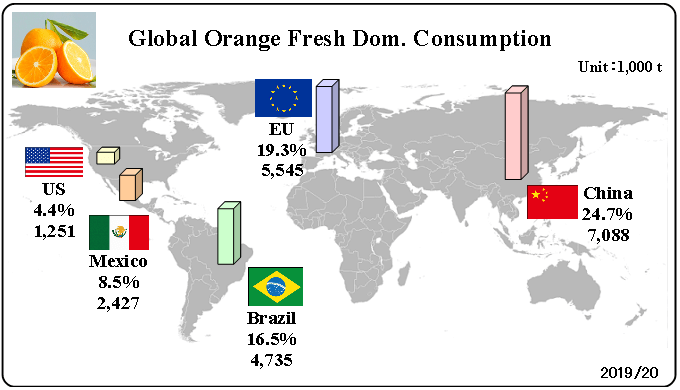
(2019/20 forecast)ref. United States Department of Agriculture (USDA)
China and the EU are main regions and account for more than 40%
- China 24.7%
- EU 19.3%
- Brazil 16.5%
- Mexico 8.5%
- US 4.4%
In a production, Brazil is a big region. But in a consumption for fresh, China and the EU are big regions. A ratio of for fresh and for processing can be changed by regions.
Next is the ratio by regions.
[Orange] Breakdown of Use by Region
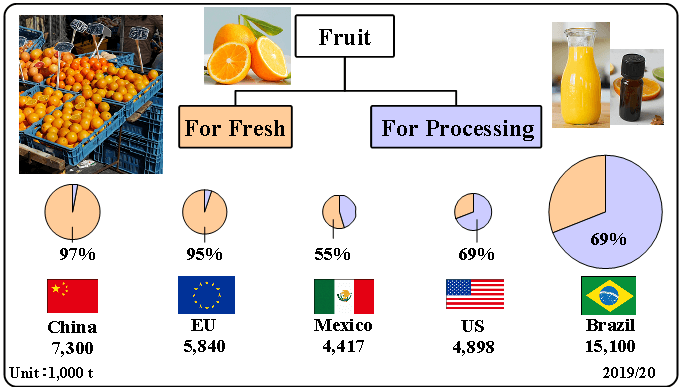
(2019/20 forecast)ref. United States Department of Agriculture (USDA)
In a pie chart, colors show use, its size shows production.
- orange color : for fresh
- blue color : for processing
- pie chart size : production
We know there is a difference ratio by region.
- China and the EU : mostly for fresh
- the US and Brazil : mostly for processing (juice and oil).
Next is a global orange consumption for processing.
Global Orange Consumption For Processing
Change of Global Orange Consumption For Processing (more than 10 years)
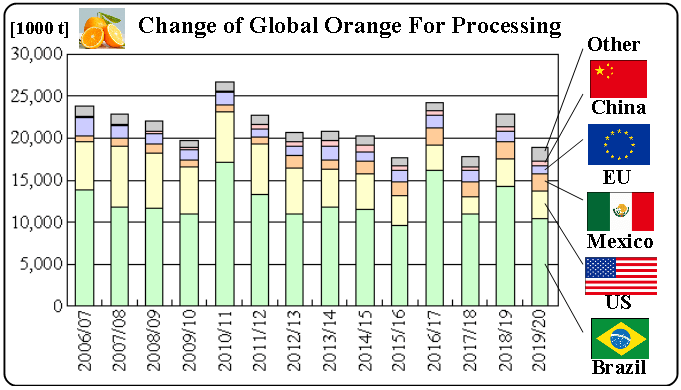
ref. United States Department of Agriculture (USDA)
Orange for processing
Global Orange For Processing : about 20 million tons
It is decreasing. And this decreasing affects a global production of juice and oil.
- Brazil : drastic change
- US : decreasing
- Mexico: increasing slightly
Next is a global orange consumption for processing with a world map.
Global Orange Consumption For Processing (Map)
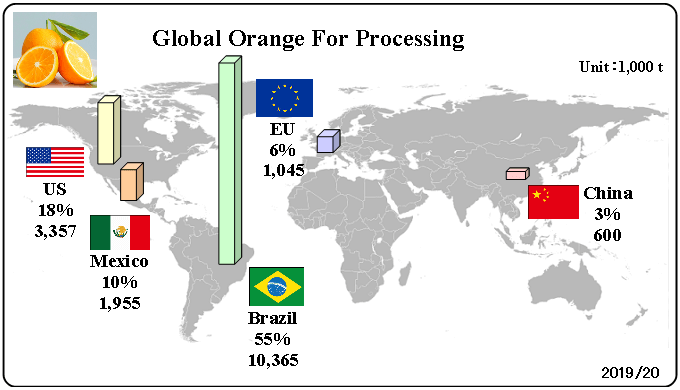
(2019/20 forecast)ref. United States Department of Agriculture (USDA)
Brazil accounts for half of the global orange consumption for processing. Brazil has a big impact on juice and oil.
- Brazil : 55%
- US : 18%
- Mexico: 10%
Next is a global orange juice production.
Change of Global Orange Juice Production (more than 10 years)
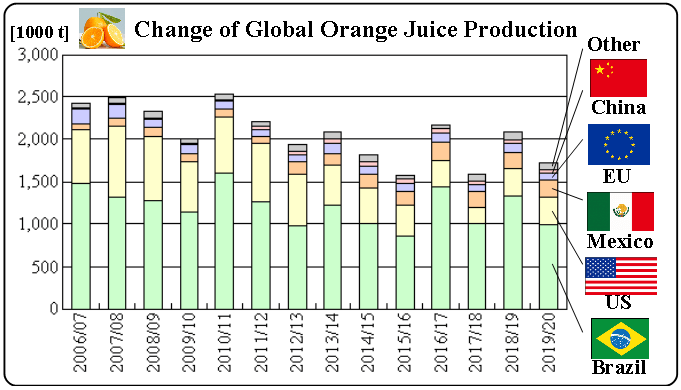
ref. United States Department of Agriculture (USDA)
Orange juice
Global orange juice production:about 2 million tons
It is decreasing. At the same time, oil production is also decreasing.
- Brazil: drastic change
- US : decreasing
Summary
Orange Production
- Global Production : 50 million tons
- For Fresh : 30 million tons
- For Processing : 20 million tons
Once the fruits are used for fresh, they can not be used for processing. We can get juice and oil from oranges for processing. The US and Brazil are main regions of orange consumption for processing. Especially Brazil is very important.